Location and Extent of the Tropical Cyclone Hazard
Tropical cyclone risk in the United States extends along the entire east coast from Maine to Florida, the Gulf Coast (including Florida, Alabama, Louisiana, and Texas), and Hawaii. The southeastern United States and Gulf Coast are at most significant risk based on historical storm tracks and the warmer waters of the Gulf of Mexico and the Atlantic Ocean. The City of New Orleans is threatened by tropical cyclones that develop in the Atlantic Ocean and the Gulf of Mexico, and the entire Parish is susceptible to hurricanes and tropical storms. The greatest threat to New Orleans comes during the Atlantic Ocean/Gulf Hurricane season, which runs from June 1 to November 30. Figure 27 shows all major historical hurricanes (Category 3 or higher) that impacted southeastern Louisiana within 100 miles of New Orleans from 1950 to 2019. The database was queried, and the map developed using NOAA’s Historical Hurricane Tracks database. Due to the variation in size, strength, and other variables in tropical cyclones, the entire New Orleans area is at risk for up to a Category 5 hurricane.
Figure 27: Major Historic Hurricanes Impacting Southeastern Louisiana
Source: NOAA Coastal Service Center – Historical Hurricane Tracks Database
Severity of the Tropical Cyclone Hazard
The severity of hurricanes and tropical storms is measured primarily by wind velocity, flooding, central pressure, and storm surge. Using a system known as the Saffir-Simpson Hurricane Scale, Hurricanes are classified as Categories 1 through 5 based on wind speed and damage potential (Table 21).
Table 21: Saffir-Simpson Hurricane Scale
| Category |
Winds |
Damage |
| 1 |
74 - 95 mph |
Minimal: Damage to building structures possible, primarily to unanchored older model mobile homes. Damage to poorly constructed signs, shrubbery, and trees. Loose outdoor items become projectiles. Numerous power outages. |
| 2 |
96 - 110 mph |
Widespread from very strong winds: Some roofing material, door, and window damage to buildings. Considerable damage to trees, vegetation, mobile homes, and piers. A number of high-rise building glass windows dislodged to become projectiles. Widespread power outages up to several days |
| 3 |
111 - 129 mph |
Extensive from dangerous winds: Some structural damage to small residences and utility buildings with minor amount of wall failures. Mobile homes destroyed. Many trees uprooted or snapped. Power outages lasting several days or weeks. |
| 4 |
130 - 156 mph |
Devastating from extremely dangerous winds: Some wall failures with complete house roof structure failures. Extensive damage to doors, windows, and trees. Electricity unavailable for weeks. |
| 5 |
> 156 mph |
Catastrophic: Complete roof failure on many residences and industrial buildings. Some complete building failures with small buildings blown over or away. Power outages for weeks or months. |
Source: National Oceanic and Atmospheric Administration (NOAA)
Previous Occurrences of the Hurricane and Tropical Storm Hazard
The following tables provide data obtained from NOAA for hurricanes and tropical storms from 1994 to 2019. During this period, there were eight hurricanes and 15 tropical storm events that affected New Orleans. According to the NOAA data, the total property damage from 1994 to 2019 was over $3.6 billion, which includes over $3.5 billion in property damage resulting from Hurricane Katrina in 2005.
Table 22: Tropical Cyclone (Hurricane) Events, Orleans Parish, 1994-2019
| Date |
Type |
Name |
Deaths |
Injuries |
Property Damage |
| 7/17/1997 |
Hurricane (Typhoon) |
Hurricane Danny |
0 |
0 |
$0 |
| 9/27/1998 |
Hurricane (Typhoon) |
Hurricane Georges |
0 |
0 |
$6,000,000 |
| 10/2/2002 |
Hurricane (Typhoon) |
Hurricane Lilli |
0 |
0 |
$5,540,000 |
| 9/15/2004 |
Hurricane (Typhoon) |
Hurricane Ivan |
0 |
0 |
$240,000 |
| 7/5/2005 |
Hurricane (Typhoon) |
Hurricane Cindy |
0 |
0 |
$17,000,000 |
| 8/28/2005 |
Hurricane (Typhoon) |
Hurricane Katrina |
638 |
0 |
$3,560,000,000 |
| 9/1/2008 |
Hurricane (Typhoon) |
Hurricane Gustav |
0 |
0 |
$6,170,000 |
| 8/28/2012 |
Hurricane (Typhoon) |
Hurricane Isaac |
0 |
0 |
$26,800,000 |
| Totals |
|
|
638 |
0 |
$3,621,750,000 |
Source: NOAA National Centers for Environmental Information
Table 23: Tropical Storm Events, Orleans Parish, 1994-2019
| Date |
Type |
Magnitude |
Deaths |
Injuries |
Property Damage |
| 9/10/1998 |
Tropical Storm |
Tropical Storm Frances |
0 |
0 |
$4,300,000 |
| 9/19/1998 |
Tropical Storm |
Tropical Storm Hermine |
0 |
0 |
$0 |
| 8/4/2002 |
Tropical Storm |
Tropical Storm Bertha |
0 |
0 |
$0 |
| 9/14/2002 |
Tropical Storm |
Tropical Storm Hanna |
0 |
0 |
$0 |
| 9/25/2002 |
Tropical Storm |
Tropical Storm Isidore |
0 |
0 |
$6,390,000 |
| 6/30/2003 |
Tropical Storm |
Tropical Storm Bill |
0 |
0 |
$2,000,000 |
| 10/9/2004 |
Tropical Storm |
Tropical Storm Matthew |
0 |
0 |
$3,000 |
| 7/10/2005 |
Tropical Storm |
Hurricane Dennis |
0 |
0 |
$0 |
| 9/23/2005 |
Tropical Storm |
Hurricane Rita |
0 |
0 |
$0 |
| 9/11/2008 |
Tropical Storm |
Hurricane Ike |
0 |
0 |
$100,000 |
| 11/9/2009 |
Tropical Storm |
Hurricane Ida |
0 |
0 |
$0 |
| 9/2/2011 |
Tropical Storm |
Tropical Storm Lee |
0 |
0 |
$10,000 |
| 9/2/2011 |
Tropical Storm |
Tropical Storm Cindy |
0 |
0 |
$10,000 |
| 6/20/2017 |
Tropical Storm |
Hurricane Barry |
0 |
0 |
$0 |
| 7/12/2019 |
Tropical Storm |
Tropical Storm Frances |
0 |
0 |
$0 |
| Totals |
|
|
0 |
0 |
$12,813,000 |
Source: NOAA National Centers for Environmental Information
Hurricane Katrina
Hurricane Katrina made landfall as a powerful Category 3 Hurricane that had a devastating impact on the New Orleans area and the entire Gulf Coast region. The storm initially formed over the southeastern Bahamas on August 23, 2005, as Tropical Depression 12. As the cyclone moved north and eventually west of the Bahamas, it continued to strengthen, reaching Category 1 hurricane status on August 25 shortly before making landfall on the southeast coast near Miami, Florida. Once back over open water, the storm quickly gained strength and briefly reached Category 5 intensity over the central Gulf of Mexico before making landfall near Buras, Louisiana, as a Category 3 hurricane.
On August 29, 2005, Hurricane Katrina made landfall with maximum sustained winds of 130 mph and a massive storm surge of up to 28 feet that devastated parts of the Gulf Coast. The NHC attributed the catastrophic storm surge to several factors, including the size of the storm and the vast area of hurricane-force winds. See the Flood hazard profile for additional details about the storm surge associated with Hurricane Katrina.
Although storm surge and flooding from levee breaches were the dominant cause of damage, high winds from Hurricane Katrina caused considerable damage to some regions of the City of New Orleans and the Gulf Coast. As the eye of the storm passed to the east of New Orleans, wind speeds near the center and to the east of the storm were near Category 3 intensity on the Saffir-Simpson scale. To the west of the eye, the NHC estimates that sustained winds throughout the New Orleans metropolitan area were less than Category 3 intensity. At the surface, the New Orleans area most likely experienced maximum sustained winds between 96 -110 mph (Category 2).
Along the Gulf Coast, inland from the storm surge areas, the leading causes of damage were high winds and wind-borne debris. After Katrina, FEMA studied the performance of buildings from New Orleans to Mobile, Alabama. The results were published in the July 2006 report titled “Hurricane Katrina in the Gulf Coast, Mitigation Assessment Team (MAT) Report” (FEMA 549). This report included the assessment of wind-induced envelope damage to residential, commercial, and critical facilities. It concluded that high winds and wind-borne debris from Katrina caused significant damage to roof systems, windows, exterior-mounted electrical, mechanical, and communication equipment. Blow-off of building envelope components and rooftop equipment also caused damage to adjacent buildings, as well as to the building themselves. Common windborne building envelope debris during Hurricane Katrina included roof coverings (particularly aggregate surfaces and asphalt shingles) and vinyl siding.
Although wind speeds in the New Orleans area were approximately 100 mph, slightly higher wind speeds were most likely experienced at elevations above the surface, as evidenced by the damages that occurred to many of the downtown high-rise buildings. Many of the high-rises experienced extensive window damage, which then allowed wind-driven rain into the interior. As noted in FEMA 549:
Several buildings in downtown New Orleans had isolated window breakage. These windows may have been broken by windborne debris, or they may have been weakened by scratches and failed when over-stressed by wind pressure. However, nine buildings along or near Poydras Street had extensive glazing damage that was indicative of damage caused by windborne roof aggregate. Except for two of these buildings, virtually all of the glazing damage occurred on the windward facades.
FEMA 549 indicates that the damages to the buildings within Cluster A were generally more significantly damaged than in Cluster B. This figure is followed by a sample of the type of window glazing damage that was experienced due to windborne debris from the high winds. Window glazing is considered the glass on the exterior of the building.
As mentioned earlier, Katrina’s winds also caused damage to rooftops and exterior windows and doors, allowing wind-driven rain to penetrate into the interior of both residential and commercial structures. After the hurricane, the National Institute of Standards and Technology (NIST) also studied the performance of structures and found that roof failures on buildings and residential structures were evident throughout the area. Typical roof damage included the failure of roof coverings, loss of roof decking, and, in some cases, the support structure. This is consistent with the conclusions found within FEMA 549. Figure 28 shows typical roof damage to residential structures in New Orleans. Most of the residential structures inspected by the MAT had asphalt shingle roof coverings. The vast majority of the observed roofs experienced damage, ranging from loss of a few hip trim shingles or tabs to loss of a large number of shingles and underlayment. FEMA 549 indicates that the house in the lower right-hand corner is circled to highlight that the roof damage was most likely initiated by blow off of a deck panel from the corner.
Figure 28: Typical Wind Damage to Residential Structures – Hurricane Katrina
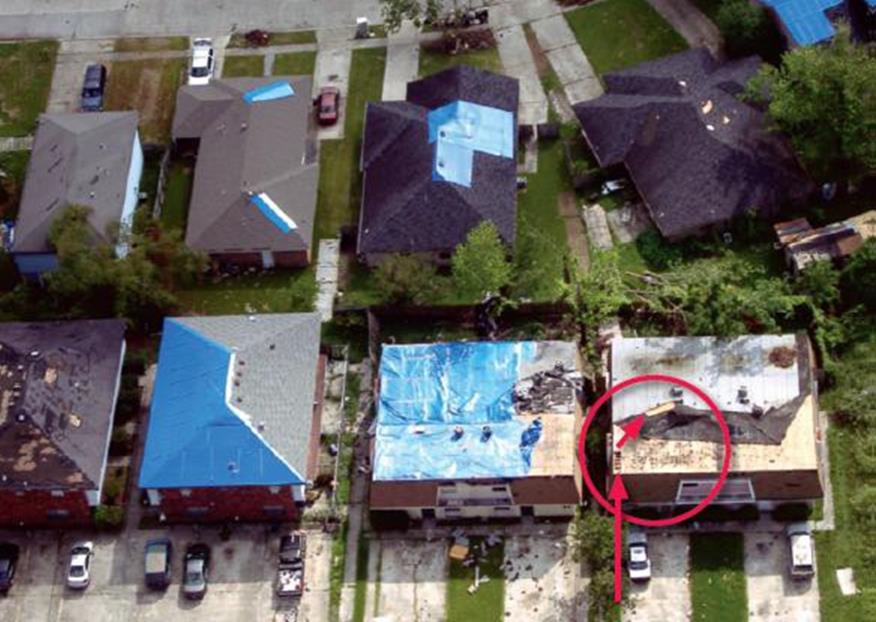
Source: Hurricane Katrina in the Gulf Coast, Mitigation Assessment Team (MAT) Report Hurricane, FEMA 549, July 2006
Table 24: Summary of Damages and Deaths from Hurricane Katrina
| |
Orleans Parish |
Louisiana |
Louisiana, Mississippi, Alabama |
| Total Damages |
$16.9 Billion |
$38.8 Billion |
$81 Billion |
| Number of Structures Damaged or Destroyed flood, storm surge, and wind |
134,344 |
205,000 |
275,000 |
| NFIP estimated paid claims, $ |
$7.9 Billion1 |
$12.6 Billion |
$15.3 Billion |
| Schools Damaged |
1242 |
875 |
1,154 |
| Deaths |
800 |
1,464 |
1,810 |
Note 1: Estimate of $7.9 billion for Orleans Parish based on 83,500 claims in the New Orleans area with an average claim of $94,803.
Note 2: Estimate is for public schools only. All Orleans Parish School Board (OPSB) schools experienced at least minor damage. Approximately 33 were severely damaged.
Sources include: General Accounting Office: NFIP, New Processes Aided Hurricane Katrina Claims Handling, but FEMA’s Oversight should be Improved. NOAA – NCDC; LA Department of Health and Hospitals; AIR Worldwide – Insurance Information Institute; US Department of Commerce – Gulf Coast Recovery; Louisiana Recovery Authority; National Association of Home Builders - American Red Cross; Louisiana Long-Term Community Recovery Planning; FEMA Federal Insurance Administration.
Hurricane Rita
On September 24, 2005, Hurricane Rita made landfall as a strong Category 3 hurricane in extreme southwestern Louisiana just west of Johnson’s Bayou in Cameron Parish. The storm occurred only three weeks after Hurricane Katrina had a devastating impact on Louisiana and the Gulf Coast. Similar to Katrina, Rita was also an intense hurricane that, at one point in the Gulf of Mexico, was a Category 5 on the Saffir-Simpson scale.
Approximately 48 hours before reaching the Gulf Coast, the storm began to weaken. It made landfall as a Category 3 hurricane near the Texas/Louisiana border. With the exception of a small portion of western Louisiana, most of the southern part of the State experienced wind speeds ranging between 80-100 mph, the equivalent of a Category 1 or 2 hurricane.25
The highest observed wind gusts from Hurricane Rita were reported in Port Arthur, Texas, and Calcasieu Pass, Louisiana. Table 25 below provides a summary of the peak wind gusts.
Table 25: Observed Peak Wind Gusts – Hurricane Rita
| Location |
Peak Gust |
Direction |
| Port Arthur, Texas |
116 |
N |
| Calcasieu Pass, LA |
112 |
E |
| New Orleans |
42 |
NE |
| Marsh Island, LA |
93 |
S |
| Lake Charles |
74 |
NE |
Source: NOAA – Hurricane Research Division
On the day the storm made landfall, a Presidential Disaster Declaration (DR-1607) was declared for parts of southern Louisiana. In the City of New Orleans, the disaster assistance from FEMA included emergency work (Categories A and B) for public assistance. The NHC estimated the storm caused an estimated $11.3 billion in damages to the Gulf Coast. In New Orleans, the maximum sustained winds were estimated at 34 mph.[1]
Hazard Impacts
Impact on Life and Property
Past hurricanes and tropical storms have had a major impact on life and property in New Orleans. Events such as Hurricane Betsy in 1965, and more recently, Hurricane Katrina in 2005, have resulted in many hundreds of deaths and thousands of injuries. Tropical cyclone winds can cause major structural damage to private homes, businesses, and the critical facilities of the signatories through water intrusion or structural failure. Critical public safety operations like EMS service are interrupted during the event. Limb falls, fallen trees, and debris disrupt transportation and require collection and disposal. Power outages caused by tropical cyclone winds can impact healthcare facilities, disrupt essential social services, lead to a loss of food during extended outages impacts vulnerable communities, and a loss of public and private revenue caused by business interruption.
Table 26 summarizes the number of residential structures in Orleans Parish that sustained damage exclusively from high winds as a result of Hurricanes Katrina and Rita in 2005. As noted in Section on Tropical Cyclones, the storm surge associated with Hurricane Katrina overtopped or breached numerous levees protecting the City of New Orleans. The widespread flooding damaged or destroyed thousands of residential properties in the Parish, many of which also experienced wind-related damage. The data indicate that 26,965 residential structures experienced only wind-related damage (no flood damage) from Hurricanes Katrina and Rita. This total represents approximately 14.3% of the 188,251 residential structures in the Parish based on 2000 US Census data.
Table 26: Orleans Parish Residential Structures Damaged by High Winds from Hurricanes Katrina and Rita
| Occupancy |
Minor |
Major |
Destroyed |
Total |
| Owner-Occupied |
10,944 |
1,635 |
122 |
12,701 |
| Rented-Occupied |
10,855 |
3,037 |
372 |
14,264 |
| Grand Total |
21,799 |
4,672 |
494 |
26,965 |
Source: FEMA, Housing Unit Damage Estimates: Katrina, Rita, Wilma, April 2006